Financial positions
Cash Flow statement
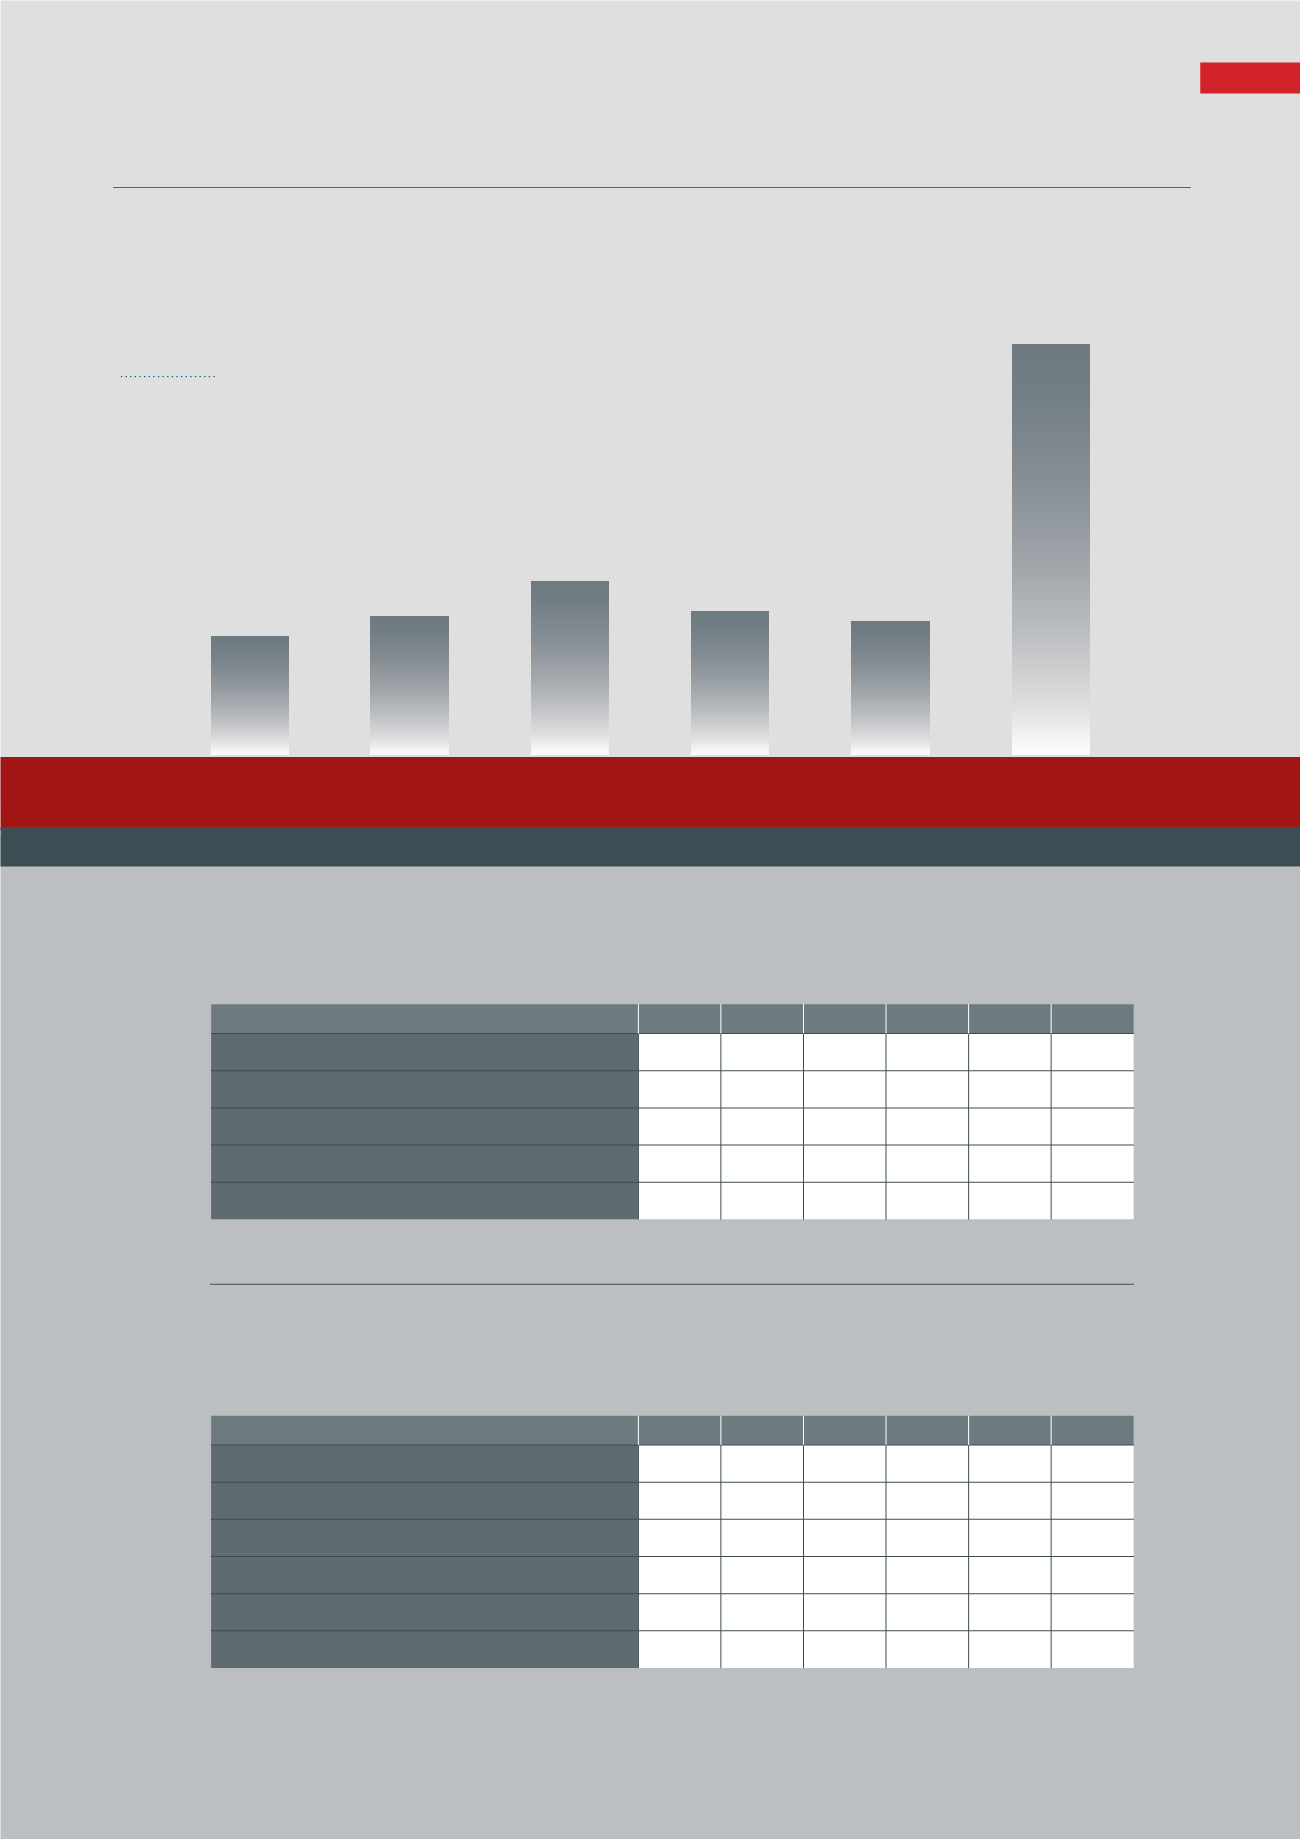
Net Profit
S$ Million
$ in million
$ in million
* FY2013 figures have been restated (refer to note 2.2 of the financial statement)
2009
2010
2011
2012
2013
2014
21.3
27
31.1
25.3
23.9
72.6
FY2009 FY2010 FY2011
FY2012 FY2013* FY2014
Current Assets
186.7 195.1
243.2 399.9 344.3 355.2
Non-current Assets
12.0 21.8 32.0 38.2 33.8 44.3
Current Liabilities
124.5 126.8 163.0 172.2 198.6 192.9
Non-current Liabilities
–
0.7
–
138.7 37.6
1.2
Equity Attributable to Shareholders
74.2 89.4 112.2 127.2 141.9 205.4
FY2009 FY2010 FY2011
FY2012 FY2013* FY2014
Net cash generated from / (used in) operating activities
76.8 34.6 31.8 (186.9)
29.0 110.7
Net cash used in investing activities
(9.1)
(5.0)
(10.7)
(8.9)
(12.1)
(6.9)
Net cash used in / generated from financing activities
24.7 (7.6)
(8.4)
128.6 (25.7)
(41.1)
Net increase/(decrease) in cash and cash equivalent
92.4 22
12.7 (67.2)
(8.8)
62.7
Cash and cash equivalent at beginning of year
51.1
143.5 165.5 178.2 111.6 102.8
Cash and cash equivalent at end of year
143.5 165.5 178.2 111.8 102.8 165.5
Hock Lian Seng Holdings Limited
Annual report 2014
7


