This printed article is located at https://hlsgroup.listedcompany.com/operations_review.html
Operations And Financial Review
FY 2024 compared with FY 2023 Performance and segmental review
Revenue

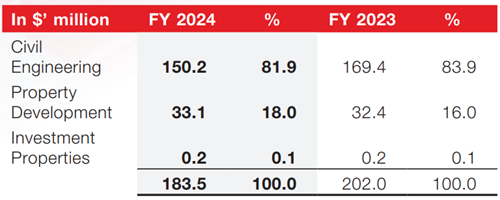
Group revenue for the financial year 2024 (FY2024) was $183.5 million, decrease of $18.5 million (-9.2%) as compared to the previous financial year (FY2023). Civil Engineering segment recorded lower sales due to the substantial completion of the the Changi Airport joint venture project in December 2023. Property Development segment recorded marginally higher revenue of $0.7 million (+2%). Sales was recorded for both Shine@Tuassouth and Ark@Gambas.
Gross Profit

Gross profit increased by $7.1 million (+30.5%) to $30.4 million. Civil Engineering saw a significant rise in gross profit to $17.1 million, up from $11.5 million in the previous year. The higher Civil engineering’s gross profit was mainly due to the finalisation of accounts as CAG JV project near completion. Higher revenue has also resulted in higher gross profit for the Property Development segment.
Other Income
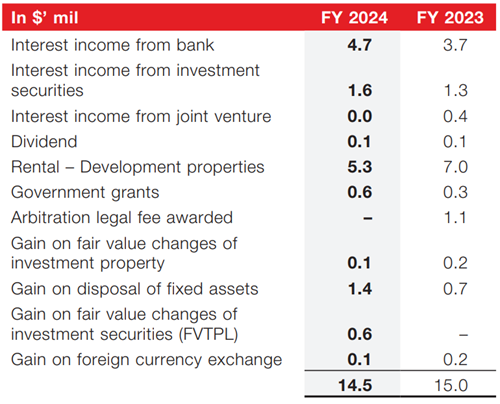
Other income amounted to $14.5 million, a decrease of $0.5 million (-3%). This is mainly due to the lower rental income of $1.7 million for unsold units and the lack of one off legal cost award of $1.1 million in 2023, offset by higher interest income of $0.9 million and fair valuation gain for investment securities of $0.6 million and gain on sales of fixed assets $0.7 million.

Distribution and selling costs
Higher distribution cost was related to the commission expenses for sales of development properties.
Administration costs
Higher administration costs recorded for FY2024 was due to higher performance bonus and staff cost.
Profit before tax and tax expenses
In summary, the higher FY2024 profit before tax was contributed by the gross profit due to finalisation of CAG JV project, offset by higher administrative cost and lower other income.
Earning per share improved from 5.19 cents to 6.25 cents for FY2024.
Financial position and cash flow review
Non-current assets was $44.5 million, decreased by $6.5 million as compared to end of 2023, mainly due to the repayment of shareholder loan of $8.1 million and $2.2 million dividend payout by the Mattar residential joint venture project, offset by additional acquisition of long term investment securities of $3.8 million.
Net current asset increased by $32.8 million, mainly due to the higher cash balance of $26.8 million, higher contract assets (net of contract liabilities) of $12.0 million due to the higher constructions works pending certification, lower trade and other payable and receivable of $2.9 million (net), net increase in short term investment securities of $6.1 million and lower provision of $6.2 million (due to the progressive utilisation of maintenance provisions), offset by the reduction in development properties of $20.0 million with cost recognised for the sales of development units and higher tax provision $1.3 million.
Higher cash balance of $26.8 million was mainly due to cash generated from operations of $32.4 million, loan repayment and dividend of $10.3 million from joint venture, offset by the net cash outflow for the purchase and redemption of investment securities of $8.3 million and dividend payment of $7.7 million. Net cash generated from operations was mainly contributed by the proceeds from the sales of development properties and release of partial retention of CAG JV project.
Investment securities (current and non-current) increased by $9.9 million to $39.2 million, mainly due to the new addition of bonds and credit linked note of $14.1 million, gain in market value of $1.6 mil offset by the redemption of bonds at $5.8 million.
Shareholders equity stood at $284.0 million as at 31 December 2024, $25.3 million higher than 31 December 2023. This is mainly due to the current period net profit after tax of $32.0 million offset by the dividend payment of $7.7 million and fair value gain for investment securities (recognised in comprehensive income) of $1.0 million.
Net asset per share was 55.6 cents as at 31 December 2024 (50.60 cents as at 31 December 2023).